


In recent years, with the development of smart city construction in China, the concept of 3D visualization system integration has been gradually introduced to people. Are some wisdom of the construction of the city big data visualization platform to realize the city core operation system integration and to present the key data, thus to include emergency command, urban management, public security, environmental protection, infrastructure and other fields of management decision support, and promote urban comprehensive management level.
BIM technology is combined with IBMS system, Internet of Things technology and cloud computing technology are used to create a new operation and maintenance platform, 3D operation and maintenance system integration platform. Scientific management of building space, equipment and assets, prevention of possible disasters, so that building operation and maintenance work to a new height of intelligent building. It can be widely used in large-scale construction, rail transit, multi-construction network operation and maintenance and other industries.
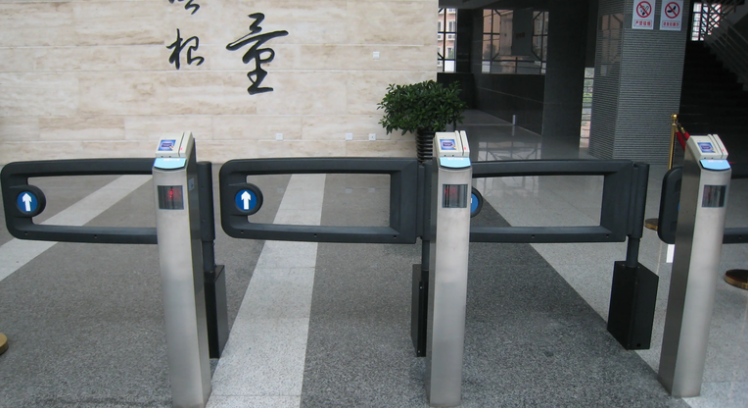
Intelligent integration system (IBMS) is a in technology, quality management, construction management has a high requirement on the project, we specially designed for the project drew up this system design specification, in order to participate in the project staff to building intelligent building management system function, design and requirements of understanding, and to determine the standard of the system design. Our design according to the nature of a complex building, the use of advanced, mature technology on the weak current subsystem of the whole building, Including construction equipment management system (BAS), automatic fire alarm system (FAS), the public security system (alarm, monitoring system, entrance guard system, parking management system) smart card application system (entrance guard system, parking management system), information guide and release system, equipment and engineering archives management system integration, To form a unified, interrelated, coordinated and linked comprehensive management system running on the same platform, to achieve a high degree of building information sharing.
At present, the application of the whole BIM technology is concentrated in the early stage of design and construction, so that BIM is left idle after the building is completed and delivered. BIM 3D operation and maintenance is the trend of the future and a problem that must be solved now. With the progress of science and technology, China's informatization and intelligentization have also developed, which provides a good informatization foundation for BIM operation and maintenance.
IBMS mainly includes building automatic control system (BAS), fire control system, video surveillance system (CCTV), parking system, access control system and other subsystems. Aiming at the operation mode of the subsystem in IBMS, the BIM model of building completion can be further explored for its application in operation and maintenance.
Value of BIM combined with Internet of Things to operation and maintenance
Asset visualization
Nowadays, there are a large number of equipment assets in buildings and many kinds of them. The management efficiency is low and the practicability is poor in the traditional tab-based management. The visualization of asset management adopts innovative 3D interactive technology to incorporate important asset information into the visualization platform, which facilitates the viewing and searching of equipment status. Improve asset information control and operation efficiency.
Monitoring visualization
Building 3D monitoring visualization allows users to integrate various professional monitoring systems scattered within the building, such as moving loop monitoring, security monitoring, video monitoring, network monitoring, energy consumption monitoring, intelligent fire monitoring, etc., to integrate a variety of monitoring data, establish a unified monitoring window, and change the phenomenon of data isolation. Reverse the report forms and data flooding caused by the lack of two-dimensional information dimension, realize the value maximization of monitoring system and monitoring data effectively provide the monitoring management level.
Environment visualization
Our field investigation of building the park environment, by some technical means to obtain the park related information such as environment, buildings, equipment, through 3 d technology, the implementation of the park's overall environment visualization, visualization, visualization and all kinds of equipment room building visual browsing, show clear and complete the entire park.
In addition, the system can use the three-dimensional patrol function. Three-dimensional patrol is also called three-dimensional patrol, including three-dimensional overview, automatic patrol and manual patrol.
In the 3D overview mode, users can observe the state of the entire park at a certain height and adjust the overall perspective. Automatic patrol. The system can inspect the operation status of the whole smart park in turn according to the specified lines, and execute it in a cycle, getting rid of the traditional awkward situation of manual clicking in turn.
Manual patrol and manual patrol support and flight two modes on foot, walking mode, the operating personnel operating virtual characters in the scene move, Angle adjustment, flight mode can be achieved by a simple mouse operation, such as roller click, drag and drop, zoom, complete the height control, move around, such as operation, avoid walking mode is the possibility of equipment or building block, You can also adjust the Angle of view. During the process, users can also perform some patrol operations in the virtual scene.
Through 3D visualization and 3D patrol function, we can manage and query the park and various buildings and equipment in the park, provide visual management means for managers, and improve the overall control power and management efficiency of the building.
Spatial visualization
Several kinds of capacity indicators in the building 3D visualization system are presented in two ways: 3D visualization and tree data presentation. Unit building capacity index can be set, the space capacity, power capacity, load-bearing capacity of automatic statistics, analysis of the current capacity status and remaining capacity and use.
Can also specify the room according to the set load bearing and power consumption and other demand indicators for automatic space search query. Make the space use resource balance, and can generate data analysis report, improve the use efficiency and management level of the building.
Pipeline visualization
Nowadays, the relationship of pipelines in the building is more and more complex, such as electricity pipelines, network pipelines, drainage pipelines, air conditioning pipelines, network wiring and other chaotic, in the traditional form management mode of management efficiency is low, poor practicability. Our 3D pipeline visualization module adopts innovative 3D interactive technology to realize the visual management of various pipelines of the building.
It can be integrated with the ASSET configuration Management system (CMDB) to automatically generate and delete the port and link data of devices in the CMDB. In a 3D environment, you can click device Port to view the usage and configuration of the device port, realizing automatic synchronization with the asset configuration management system.
At the same time, wiring data can also be imported through tables, or support integration and docking of external system data. And provides a visual way for hierarchical information browsing and advanced information search capabilities. Let the rigid data become simple and flexible, improve the use and efficiency of pipeline search management.
Remote control visualization
In the visual environment of the squadron equipment intuitive observation and analysis, through the integration of remote control system, realize the remote control of equipment visualization, make the operation and maintenance more simple and quick.
Geographic information display
Using Google Earth Earth (GIS), three-dimensional panoramic way classification for each building to browse, with intuitive interactive 3 d scene browse technology, to achieve the hierarchical progressive global level state-level browse, browse, province level view and city level browsing, step by step to show mode icon or data sheet at all levels within the scope of the node.
In addition, the corresponding schematic diagram of the buildings selected by the mouse can be displayed through suspension, and then the 3D scene of each building can be entered by clicking. This is very convenient and flexible for the view of multiple buildings, which is conducive to daily management.
The deployment of
The deployment architecture of the visual system is very simple. In the building management end, only THE PC Server needs to be deployed as the system Server, through the local area network and the existing building other management systems and data exchange.
The visual system supports the B/S architecture. Remote desktop users or large-screen display terminals only need to log in to the visual system server using Internet Explorer to access and browse the visual system without installing an independent client. The visual system supports the deployment of multiple servers to meet reliability requirements.
Post time: Jun-11-2022